Qualtrics and REDCap offer different features. Qualtrics is better for one-time data collection, while REDCap is better for longitudinal data collection. Qualtrics has a more intuitive interface and more design options, while REDCap offers more data export options and security.
Web-based survey tools are frequently updated. To ensure awareness of Qualtrics and REDCap enhancements, please review the support links in the ‘Resources’ section regularly.
Qualtrics
Qualtrics is available at no cost to all UI Faculty, Staff, Trainees and Students. Support articles for this program are offered through InformationTechnology Services (ITS) and Qualtrics. ITS also offers a useful Getting Started with Qualtrics Guide.
To access/log-in to Qualtrics: https://uiowa.qualtrics.com
Simple Logic Quotas
The purpose of a quota is to ensure that you gather only the exact number of responses required for your study and avoid over-enrollment. This is important, since exceeding the number of IRB-approved research subjects is considered noncompliance and needs to be reported to the IRB in a Reportable Event Form (REF). For research that qualifies as Exempt Status, the Principal Investigator (PI) does not need to specify the total number of subjects. However, over-enrollment may lead to exceeding your budget if compensating research subjects, since the IRB would expect all subjects completing the survey to be compensated.
Some caution is needed when using quotas. They are not foolproof. Quota information is not saved until the respondent submits their survey. Since more than one person can enter the survey at a time, there is a chance that multiple people may submit answers at the same time, possibly resulting in going over quota. Below is an introduction to simple logic quotas. In simple logic quotas you define what conditions need to be met for a respondent to meet your quota. Qualtrics Support offers additional information about quotas, including how to use cross logic quotas.
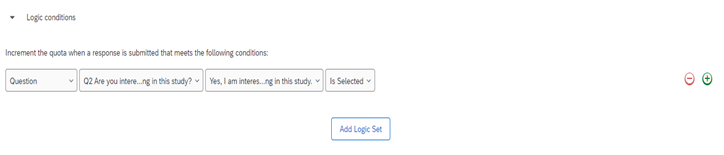
Create Simple Logic Quotas
- Go to the Survey tab > select Quotas > Click the “Add a Quota” button.
- On the next screen, there will be two choices: a simple logic quota and a cross-logic quota. Click Simple Logic Quota > Create quota.
- Specify the conditions that must be true for respondents to increment the quota. You can select whether you want to base your quota on answers to survey questions, embedded data, or other quotas. Qualtrics Support offers additional information about how to set-up simple quota conditions.
Example: Only respondents who say that they are interested in participating in this study will increment this quota.
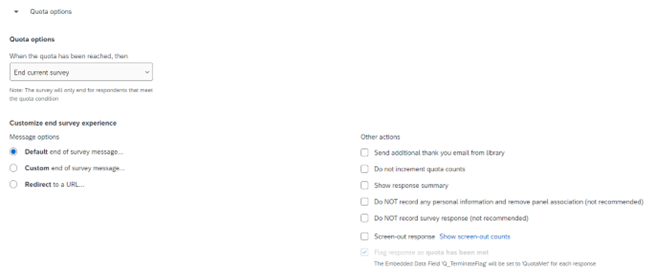
- Under Quota options, you can decide what should happen to your respondents once your quota has been met. The best way to avoid over-enrollment is to select END CURRENT SURVEY. If a respondent meets the conditions for a quota and that quota has already been filled, the respondent will immediately be directed out of the survey. You can customize the end survey experience by directing respondents to a default end survey message, custom end survey message, or a URL. It is good practice to check the following settings:
- Do not increment quota counts: Check this box to prevent over-quota respondents from incrementing quota counts.
- Do not record survey response: Selecting this option will prevent over-quota responses from being recorded in your data.
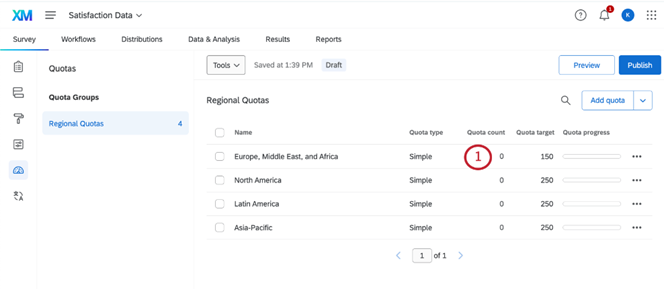
- The quota target is the maximum number of respondents you want to take your survey who fulfill the quota conditions. To set the quota target, all you need to do is click the current quota target and change it.
- Once you are all done setting up your quota(s), click the PUBLISH button at the top right of the screen.
Protect your Survey from Unwanted Responses
Fraudulent responses threaten data quality. Unwanted responses include bots or multiple submissions. Qualtrics has features to detect bots and prevent multiple submissions. Qualtrics Support offers additional information on fraud detection and how to protect your survey from unwanted responses.
Bot Detection
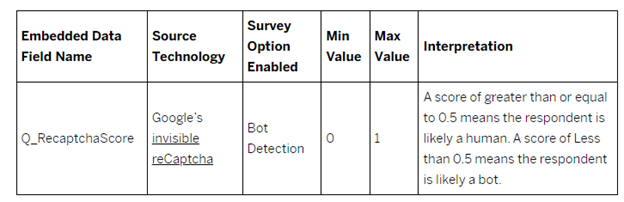
Survey tab > Survey options > Security > enable Bot detection (turn to On) > click Publish
This feature looks for respondents that could be bots and flags their responses by adding a field to each response called Q_RecaptchaScore. It is used in reporting to indicate whether a response is more likely a bot or a human.
Prevent Multiple Submissions
Survey tab > Survey options > Security > enable Prevent multiple submissions (turn to On) > Choose one of the following actions (end survey with a message, redirect to URL, or flag responses) > click Publish
This feature is not foolproof. It can also be circumvented by savvy participants clearing their browser cookies, switching to a different web browser, or using a different device.
Survey Distribution and Anonymize Responses
You can send a Qualtrics survey using an anonymous link or an individualized link. Both are found under the Distributions tab.
- The anonymous link can be included in your IRB-approved recruitment materials. Anyone who clicks on the link will be able to take the survey. It is called an anonymous link because it does not collect any identifying information such as name or email address, unless you specifically ask for this information in your survey. However, by default, the anonymous link collects the respondent’s IP address and location data. See below for how to anonymize responses.
- The individualized link is sent through Qualtrics and provides a unique link for each potential participant. Go to the Emails tab ®Compose Email. Insert your IRB approved recruitment language into the text box. Qualtrics automatically includes an individualized link as well as an opt-out link for future emails. Qualtrics provides additional information about how to set-up and use the individualized link and Qualtrics email distribution. The individualized link collects contact information such as name and email address as well as the respondent’s IP address and location data. See below for how to anonymize responses.
When thinking about the data that you wish to collect in your survey, it is important to note the difference between coded, de-identified, and anonymous data.
- Coded: labeled with a code or pseudonym so subjects can be linked to study data
- De-identified: strip or destroy the link between the ID code and subject identifiers
- Anonymous: No identifiers were ever associated with data
Enable Anonymize Responses to permanently remove identifying information, such as contact information, IP address, and location data. Go to Survey options > Security > enable Anonymize responses (turn to On) > click Publish
- When responses are gathered with the anonymous link, enable this setting to remove the respondents’ IP address and location data from your results.
- When responses are gathered with the individualized link (through Qualtrics distribution), enable this setting to remove the IP address and location data and disconnect the response from the respondent who provided it. In this way, you can know which individuals responded (through your distribution history and contact history), but not which response belongs to an individual.
Testing Surveys
It is best practice to test your survey before you begin data collection. There are multiple ways to test your survey. Below is a brief description of two preferred methods: testing with the preview link and testing with the test survey responses. These methods of testing do not count toward the response limit and will be flagged under Data & Analysis as either “Survey Preview” or “Survey Test” (can be seen in the Response Type column when you export your data into Excel).
- Testing with the preview link allows you to view and interact with the survey as your respondents would. You can turn “Mobile View On” to see what your survey will look like on a cellphone. You can take the survey (once or multiple times) and submit your response(s). You can also see what your data will look like on the backend by viewing the responses in the Data & Analysis tab.
- Testing with the test survey responses allows Qualtrics to generate test data for your survey. This is a good option if you would like to generate a large number of test survey responses. You will not be able to view and interact with the survey using this option, but you will be able see what your data looks like on the backend under the Data & Analysis tab. (Survey tab > Tools > Generate test responses. Select the number of responses that you would like to generate and click Close.)
Qualtrics Support offers additional information about testing an active survey.
Editing Active Surveys
It is best practice to finalize your survey prior to data collection. However, if needed, you can still make certain changes to your survey after it is published. Please note, you should be cautious about making changes after collecting data. Certain survey alterations can invalidate or delete parts of your already collected data.
Changes to existing surveys must have IRB approval before being distributed.
Qualtrics Support offers additional information about editing an active survey.
Changes that will not alter the survey:
- Superficial text edits (i.e., fixing a typo; font changes).
- Add a new question.
- Add new answer choices to the end of a list of options. [Note: Do not change answer choices for a drill down question.]
- Rearrange the order of questions or blocks. [NOTE: Do not use Copy & Paste. Use only the Move Up and Move Down options, which can be found by clicking the three dots at the top right of the question.]
- Edit, add, and/or remove recode values or scoring.
- Add and/or remove branch logic, display logic, or skip logic.
- Edit the Look and Feel of the survey.
- Adding new embedded data.
Changes that will alter the survey:
- Significant text edits (i.e., changing the meaning of a question).
- Delete an existing question or answer choice.
- Edits to answer choices for existing drill down questions.
- Changes to the question type (i.e., changing a question from multiple choice to slider).
- Enable or disable Autocomplete for text entry questions.
- Modify the response requirements or validation of a question.
- Rearrange answer choices with Copy & Paste. Use only Move Up and Move Down, which can be found by clicking the answer choice.
- Add or remove Loop and Merge.
REDCap
REDCap is secure web application for building and managing online surveys and databases.
The REDCap application allows users to build and manage online surveys and databases quickly and securely. REDCap can be used to collect virtually any type of data, it is specifically geared to support data capture for research studies.
Support for this program is offered through Information Technology Services (ITS) and Institute for Clinical and Translational Science (ICTS).
Additional training resources and tutorials are available on the Training Resources page.
To access/log-in to REDCap: https://redcap.icts.uiowa.edu/redcap
REDCap Features
- Build online surveys and databases quickly and securely - Create and design your project rapidly using secure web authentication from your browser. No extra software is required.
- Fast and flexible - Conception to production-level survey/database in less than one day.
- Export data to common data analysis packages - Export your data to Microsoft Excel, PDF, SAS, Stata, R, or SPSS for analysis.
- Ad Hoc Reporting - Create custom queries for generating reports to view or download.
- e-Consent - Perform informed consent electronically for participants via survey
- Easily manage a contact list of survey respondents or create a simple survey link - Build a list of email contacts, create custom email invitations, and track who responds, or you may also create a single survey link to email out or post on a website.
- Scheduling - Utilize a built-in project calendar and scheduling module for organizing your events and appointments.
- REDCap Mobile App - Collect data offline using an app on a mobile device when there is no WiFi or cellular connection, and then later sync data back to the server.
- Send files to others securely - Using 'Send-It', upload and send files to multiple recipients, including existing project documents, that are too large for email attachments or that contain sensitive data.
- Save your data collection instruments as a PDF to print - Generate a PDF version of your forms and surveys for printing to collect data offline.
- Advanced features - Auto-validation, calculated fields, file uploading, branching/skip logic, and survey stop actions.
- REDCap API - Have external applications connect to REDCap remotely in a programmatic or automated fashion.
- Data Queries - Document the process of resolving data issues using the Data Resolution Workflow module.
- Piping - Inject previously collected data values into question labels, survey invitation emails, etc. to provide a more customized experience.
- Multisite Access – External collaborators are supported.
Levels of Project Access in REDCap
Assign appropriate levels of access (privileges and permissions) for project users based on their roles and responsibilities. This helps to ensure data security and integrity and maintains the confidentiality of sensitive information.
Common levels of access:
- Project Owner/Administrator: The project owner or administrator has full control over the project. They can create and modify data collection forms, manage user access, export data, and perform all other administrative tasks. They have the highest level of access and can make any changes to the project.
- Data Manager: Data managers can create and modify data collection forms, manage user access, and export data. They can perform most administrative tasks, but they may have some restrictions compared to the project owner/administrator.
- Data Entry User: Data entry users can enter data into the project. They can view and edit data forms, but they do not have access to administrative tasks or the ability to modify the project structure.
- Data Export User: Data export users can export data from the project. They can view and download data, but they do not have access to enter or modify data forms.
- Data Viewer: Data viewers have read-only access to the project. They can view data and reports, but they cannot make any changes or export data.
- No Access: Users with no access do not have any access to the project. They cannot view or interact with the project in any way.
Before Building a New Project in REDCap
The workflow of a REDCap project involves several stages, including:
- Study design,
- Project creation,
- Data form design,
- Testing,
- IRB approval,
- Deployment, and
- Data analysis.
Before starting a REDCap project, it is important to have a clear understanding of the study design, the specific data to be collected, and the type of study. Determine who will collect study data through REDCap (research team vs. ICTS).
Types of REDCap Project Builds
- Classic Build: The traditional way of building a project in REDCap, allowing for the creation of data collection forms with customizable fields, field types, branching logic, and form layout.
- Survey Build: Specifically designed for creating online surveys with various question types and additional features like participant management and anonymous responses.
- Longitudinal Build: Used for studies that involve tracking records over multiple events or time points, allowing for the definition of events and the order and timing of data collection forms.
- External Module Build: Provides the capability to extend REDCap's functionality by creating custom external modules to enhance specific features or integrate with external systems.
Use of Calendars in REDCap
Calendars can enhance project management and data collection.
Key uses of calendars
- Event Scheduling: The calendar feature allows for scheduling events for each participant in longitudinal studies, helping to organize and manage data collection timing.
- Record-Event Association: Calendars can be used to associate events with specific records, making it easier to track and manage data collection progress for individual participants.
- Event Reminders: The calendar can be used to set reminders for upcoming events or deadlines, ensuring timely completion of project activities. Email alerts can be sent to participants or project team members.
- Event Visualization: The calendar provides a visual representation of events, allowing for better understanding of the timeline and distribution of events. Different viewing modes (month, week, day) help with planning and organizing data collection activities.
- Printing and Exporting: Calendars can be printed or exported to share event schedules with team members or participants, facilitating coordination.
Additionally, calendars can be used in data collection forms to capture date and time information. Participants can select dates from a calendar interface, improving accuracy and user-friendliness. The calendar icon next to date or datetime fields allows for easy selection, and a "Today" button is often available for quickly choosing the current date.
To Build a New Project in REDCap
- Log into REDCap using your HawkID and password
- Click ‘+New Project’ from the menu at the top of the page
- Complete the required fields in the New Project Request form
- Note- If you are collecting data for the purposes of human subjects research, review and approval of the project by the Institutional Review Board is required before data collection can begin.
- Submit the New Project request
Save a Copy of the Survey
When submitting your survey in HawkIRB, you are required to submit a screenshot or PDF of your survey.
Online Designer > View PDF > Click Print Survey > Destination Save as Adobe PDF
REDCap Best practices
- Design REDCap data collection forms prior to IRB submission. You will need to provide a link to the survey and attach copies of data collection forms to the HawkIRB application.
- Don’t move to Production mode until you have IRB approval.
- Test the project thoroughly before moving to Production mode.
- Changes to existing surveys must have IRB approval before being distributed.
- Note- Moving to Production mode in REDCap erases all existing practice records, calendar events, and associated practice data.
Resources
Institutional policies and guidelines related to survey-based research:
- Information Technology Services (ITS) Policies & Guidelines for Conducting Surveys at the University of Iowa (Support Article 1670)
- IRB Standard Operating Procedures and Researcher Guide:
- Section I, Part 8.A.iv - Administration of Surveys in Public Schools (Iowa Code 279.79)
- Section II, Part 12.B - Surveys, Questionnaires, and Interview Studies
- Section II, Part 18.A.iv Surveys (Research-Related Study Materials)
Survey Specific Links
Qualtrics:
- Qualtrics Login
- Get Started with Qualtrics Guide
- Qualtrics Support
- Testing and Editing Active Surveys
- Quotas
- Email Distribution
- ITS Support Articles for Qualtrics
REDCap:
Unexpected Events
Survey Research Support at CSSI
Survey Research Support at CSSI:
The Center for Social Science Innovation (CSSI) provides comprehensive support to University of Iowa faculty, staff, and students at every stage of the survey research process. The CSSI team partners with researchers to ensure survey studies are methodologically sound, efficiently implemented, and compliant with institutional requirements.
CSSI supports survey research in the following ways:
- Consultation and study design: Provides guidance on research questions, survey instruments, and overall study approach.
- Survey development and implementation: Programs, tests, and deploys surveys across web, phone, mail, in-person, or mixed-mode platforms.
- Sampling and recruitment: Selects appropriate samples, recruits participants, and manages incentives.
- Project logistics and data collection: Coordinates survey fielding and data entry for paper instruments.
- IRB and compliance support: Helps navigate IRB applications and adhere to university and sponsor requirements.
- Access to survey infrastructure: Expands opportunities to collect high-quality data through institutional resources and partnerships.
CSSI offers both fee-for-service support tailored to the needs of individual survey projects and free consultations to help researchers get started.
For a printable version: Survey Based Research Educational Tool
Version 3, 7/06/2026